Results and Discussion
Solar potential in Western Ghats:
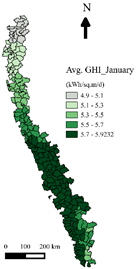
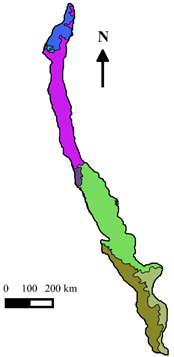
Figure 1 shows the taluk wise distribution of solar insolation in WG region, which highlight the availability of ample solar insolation to harvest energy for meeting the local electricity demand. Annual average insolation received in the region ranges from 5.3 to 5.9 kWh/m2/day. Taluks in the eastern and northern part of the WG receive more isolation (5.7 - 5.9 kWh/m2/day) compared to the southern taluks (5.3 - 5.5 kWh/m2/day). However, grid connected SPV systems are not viable in taluks with thick canopy vegetation (Evergreen/semi-evergreen). Rooftop SPV modules are viable options to meet the fundamental requirement of electricity for domestic purpose
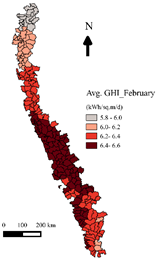
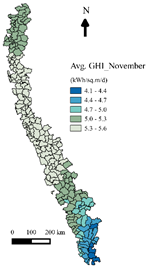
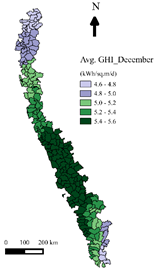
Figure 3 gives the seasonal distribution of solar insolation across the taluks. In summer (February to May), insolation ranges from 5.5 to 7.5 kWh/m2/day. Sothern taluks receive higher insolation (6 – 6.6 kWh/m2/day) in early summer (February), which moves towards northern region as summer progresses. In March and April, WG receives higher insolation in the year which ranges from 5.9 to 7.4 kWh/m2/day in all the taluks. During monsoon (June to September), insolation ranges from 3.5 to 6.1 kWh/m2/day, in which July receives lower insolation (3.9 to 5.6 kWh/m2/day). From August, solar energy reception in southern taluks increases (5 - 6 kWh/m2/day), which slowly moves towards central region as the winter approaches. In winter months (October to January), distribution of solar insolation varies from 4.1 to 6 kWh/m2/day. In December and January, most of the central and southern taluks receive higher insolation (5.2 to 6 kWh/m2/day) compared to the northern region (4.6 to 5 kWh/m2/day). As the winter recedes, insolation reception increases (>5.8 kWh/m2/day). The seasonal solar potential maps of WG reveals that, distribution of solar insolation follows a pattern which move from southern region to northern taluks (from monsoon to summer), which gives the insight for generation scheduling and secured plant operation. Forecasting of the generation from solar PV plants (in grid connected system), contributes to decide the dynamic range of grid operation and security limits. However, village level study may reveal better information to decide the precise grid operation constraint to keep the grid stress free and connected to the load reliably
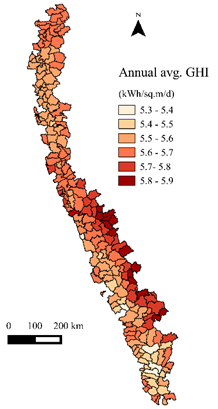
Figure 1: Taluk wise annual average solar insolation in WG region
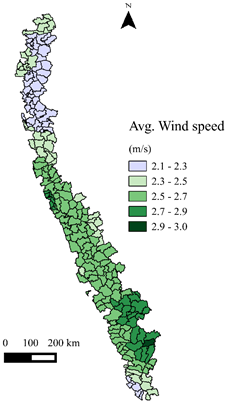
Figure 2: Taluk wise annual average wind speed in WG region
Wind potential in WG:
Taluks in the higher altitude and planes experience higher wind speed compare to the interior and costal region. Annual average wind speed ranges from 2.1 to 3 m/s throughout the region, where taluks in the south-eastern region experience higher wind speed (2.7 to 3 m/s). Figure 2 shows the taluks wise wind regime of the WG region. Taluks in the central and southern region experience higher wind speed (2.5 - 3 m/s) compared to the northern region (2.1 - 2.5 m/s), annually
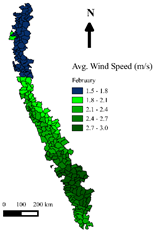
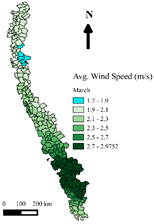
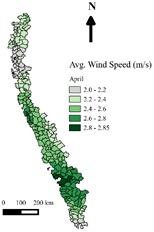
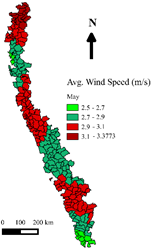
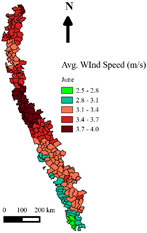
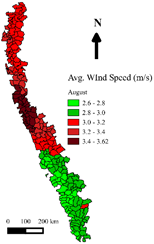
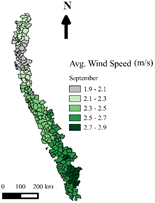
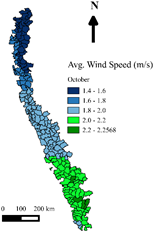
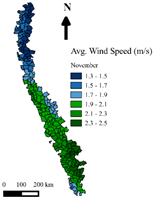
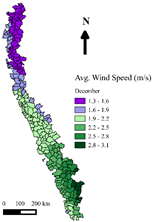
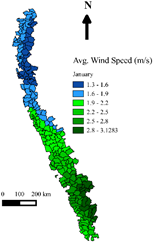
Taluk wise seasonal distribution of wind speed is given in Figure 4, which also gives the high potential areas. During summer (February to May), wind speed varies from 1.5 to 3.37 m/s, where the northern taluks experience lower wind speed (1.5 to 2.1 m/s) compared to central and southern region (2.3 to 3.37 m/s). WG region experiences higher wind speed in monsoon season (June to September) due to the south-west monsoon. Speed of wind ranges from 2.5 to 4.1 m/s (in June, July and August) which decreases (in September, 1.9 to 2.9 m/s) as monsoon recedes. The central taluks of WG receives swift winds (3.7 to 4.1 m/s) which are high potential areas. However, change in the direction of wind is not suitable for power plant installation, which gives the extreme power outputs. During winter months (October to January), average wind speed in the region varies from 1.3 to 3.1 m/s, in which northern taluks experience lower wind speed (1.4 to 1.9 m/s). Nevertheless, central and southern taluks experience higher wind speed ranging from 2 to 3.1 m/s annually. The seasonal wind speed maps of WG reveals the taluk wise energy potential in the region. The south-eastern taluks consistently showed higher potential which also include some of the hilly regions including Ooty, Elivai malai, Perumal peak, Annamudi, Munnar and valley at Palaghat. Many of these regions are rich in biodiversity, have rare endemic flora and associated fauna. Since the wind power plants need vast disturbance free area, open area such as coast, planes are to chosen instead vegetated regions. However, potential analysis shows the harvestable energy of the region which gives the scope for generation forecasting, scheduling and to enhance the plant security. It also helps in village level plant installation to meet the community demand in a decentralised manner.
Seasonal variability in solar and wind potential:
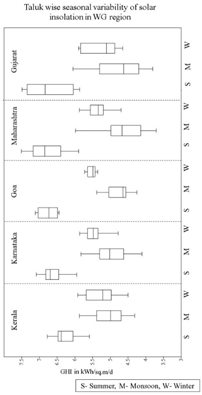
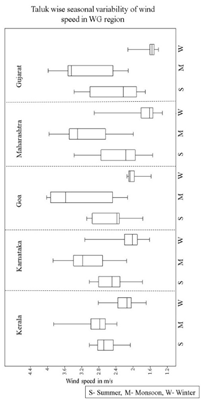
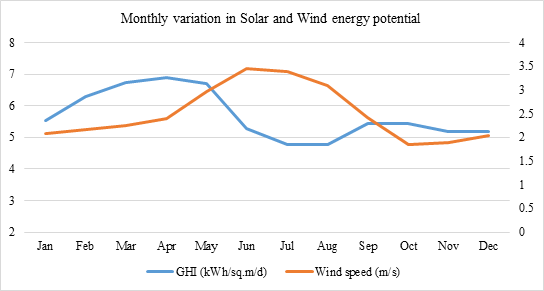
RE sources are intermittent in nature and the variation cause the variation in the output. Optimisation of RE resources requires the understanding of seasonal variability including diurnal variation. Figure 5 gives the taluk wise variability in solar and wind potential in WG region. Annual average insolation in Maharashtra during monsoon (Figure 5 (a)) shows high variability compared to other states. Goa experiences lower variability in insolation reception compared to other taluks annually. Insolation reception is almost same during summer across the states, however Gujarat shows higher potential. Wind speed shows high variability and higher energy potential in all the states during monsoon months (Figure 5 (b)) compared to other seasons. Overall, wind speed is highly variable in all the season which also varies the harvestable energy potential of the region. Figure 6 shows the monthly variation of wind speed and solar insolation in WG region, which infers that higher wind speed potential compliments the lower insolation reception from June to September (monsoon). This also shows that solar insolation reception from January to May compliments the lower wind speed. This endorses the hybridisation of energy resources to have the reliable energy generation throughout the year. Study using higher resolution wind speed data may provide precise wind regime for regional level (village level) to analyse the energy potential variability analysis.
Energy generation from solar potential using available wasteland:
Electric energy can be harvested directly from solar radiations using solar photovoltaic (SPV) cells (modules). These SPV modules can be mounted on rooftop (domestic supply) or can be installed in an outdoor area (wasteland/barren land) for higher capacity of generation which shall meet the irrigation and commercial electric energy demand. Land use by power plants is one of the major factors to be considered in the early stage of planning of any power plant. The assessment shows that to setup 1 kW solar power plant (SPV based) land required is about 100 m2. Scope for solar energy is assessed considering the present energy demand and extent of wasteland available in the state.
[WINTER]Figure 3: Seasonal distribution of solar insolation across the taluks in WG region
Figure 4: Seasonal distribution of wind speed across the taluks in WG region
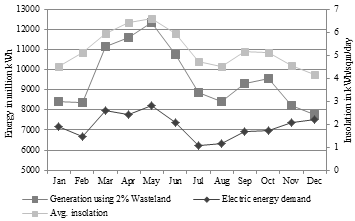
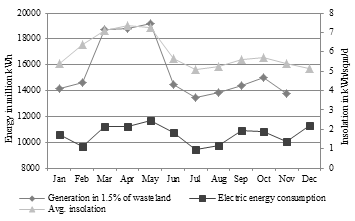
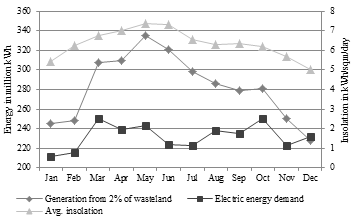
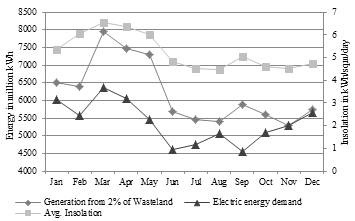
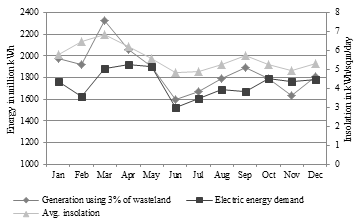
Figure 7 shows the month wise electric energy that could be generated using a fraction of wasteland area (Gujarat – 2%, Maharashtra – 1.5%, Goa – 2%, Karnataka – 2% and Kerala – 3%) and the monthly elctric energy demand. The electric energy consumption in the states of WG region varies seasonally. Electricity consumption is more during summer months while the solar insolation received is also higher. Energy consumption decreases during monsoon, where the insolation is lower. The figure shows that the electricity required follows the solar energy potential in all the states. Table 1 gives the wasteland area required to mee the electricity demand in all the states of WG region.
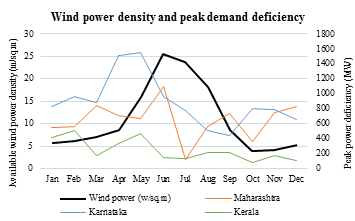
Wind energy density map shows that peak power deficiency in Maharashtra, Karnataka and Kerala occur when the wind density is high. Harvesting wind would help in meeting the peak demand. The assessment shows that wind power potential can significantly contribute in supplying the peak power demand from March to August.
Table 1: State wise annual electric energy and wasteland required to supply using solar potential
State |
Available wasteland (km2) |
Total energy consumption in 2011 (GWh) |
Required wasteland to meet the demand (km2) |
Gujarat |
20108.06 |
86485 |
402.16 (2%) |
Maharashtra |
37830 |
127488 |
567.45 (1.5%) |
Goa |
489.08 |
2785 |
9.78 (2%) |
Karnataka |
13030.62 |
64519 |
260.6 (2%) |
Kerala |
2445.63 |
20943 |
73.36 (3%) |
Figure 5: Variability in solar energy and wind speed potential in WG region
Figure 6: Monthly variation of solar insolation and wind speed in WG region
KERALA
Figure 7: Electric generation using renewable potential in waste land (state wise)
SOLAR ENERGY INCENTIVES IN WESTERN GHATS STATES
Most of the Indian states have come up with generation based incentives (GBI) and feed in tariff (FIT) mechanism to promote electricity generation from solar energy and to connect the solar power plants to grid. Solar policies and tariff structure for grid connected solar plants in WG states are discussed in Table 2.
Table 2: Tariff structure for grid connected solar plants
Gujarat [15] |
Commissioning period |
29 Jan 12 to 31 Mar 13 |
1 Apr 13 to 31 Mar 14 |
1 Apr 14 to 31 Mar 15 |
Levelised tariff for 25 years on 1 kW – 1 MW capacity solar PV power plants |
With accelerated depreciation |
INR 11.14/kWh |
INR 10.36/kWh |
INR 9.63/kWh |
Without accelerated depreciation |
INR 12.44/kWh |
INR 11.57/kWh |
INR 10.76/kWh |
Levelised tariff for 25 years on > 1 MW capacity solar PV power plants |
With accelerated depreciation |
INR 9.28/kWh |
INR 8.63/kWh |
INR 8.03/kWh |
Without accelerated depreciation |
INR 10.37/kWh |
INR 9.64/kWh |
INR 8.97/kWh |
Levelised tariff for 25 years on solar thermal power plants |
With accelerated depreciation |
INR 11.55/kWh |
Without accelerated depreciation |
INR 12.91/kWh |
Maharashtra [16] |
Levelised tariff for 25 years on > 1 MW capacity solar PV power plants |
With accelerated depreciation |
INR 14.95/kWh |
Without accelerated depreciation |
INR 17.91/kWh |
Levelised tariff for 25 years on 1 kW – 1 MW capacity solar PV power plants |
With accelerated depreciation |
INR 15.45/kWh |
Without accelerated depreciation |
INR 18.41/kWh |
Levelised tariff for 25 years on solar thermal power plants |
With accelerated depreciation |
INR 12.85/kWh |
Without accelerated depreciation |
INR 15.31/kWh |
Goa [17] |
Levelised tariff for 25 years on solar PV power plants |
With accelerated depreciation |
INR 7.01/kWh |
Without accelerated depreciation |
INR 7.74/kWh |
Levelised tariff for 25 years on solar thermal power plants |
With accelerated depreciation |
INR 10.73/kWh |
Without accelerated depreciation |
INR 11.88/kWh |
Karnataka [18] |
Levelised tariff for 25 years on > 1 MW capacity solar PV power plants |
INR 8.40/kWh |
Levelised tariff for 25 years on 1 kW – 1 MW capacity solar PV power plants |
With 30% capital subsidy |
INR 7.20/kWh |
Without subsidy |
INR 9.56/kWh |
Levelised tariff for 25 years on solar thermal power plants |
INR 10.92/kWh |
Kerala [19] |
Levelised tariff for 25 years on > 1 MW capacity solar PV power plants |
INR 10.41/kWh |
Levelised tariff for 25 years on 100 kW – 1 MW capacity solar PV power plants |
INR 12.49/kWh |
Levelised tariff for 25 years on 1 kW – 100 kW capacity solar PV power plants |
INR 12.49/kWh |
RECOMMENDATIONS FOR SUSTAINABLE ENERGY DURING 21ST CENTURY
Solar energy based generation seems promising and environmental friendly option to meet the growing demands. India is blessed with the good solar potential and harvesting this potential would minimize the environmental implications associated with the fossil fuels. Solar PV technology has the potential to meet the domestic and irrigation demands in the decentralized way. Appropriate policy incentives might help in the large scale deployment of solar devices at household levels. There is a need to focus on energy efficient decentralized electricity generation technologies with micro grid and smart grid architecture, which would go long way in meeting the energy demand. In this regard, suggestions are:
-
Electricity generation using SPV and CSP technologies would bridge the demand supply gap as India receives abundant solar energy of more than 5 kWh/m2/day for about 300 days in a year. The adequate potential with mature technologies and apt policy incentives would help in meeting the electricity demand in a region.
-
Roof top based SPV would help in meeting the household energy demand in rural as well as urban households. Rural household require about 70-100 kWh per month and to meet this requirement 5-6 m2 rooftop is adequate (at η=10%, and insolation of 5 kWh/m2/day) and the average rooftop in rural locations in Karnataka is about 110 m2 and about 115 m2 in urban localities.
-
Adequate barren /waste land is available in Karnataka as the available waste land is about 7% of the total geographical area less than 1% area is sufficient to generate electricity required for irrigation and domestic sector through SPV installation.
-
SPV installation in waste/barren lands supports decentralized electricity generation and enables multi utilization of the area for activities such as grazing, livestock farming, etc. About 45 million households are still not electrified in India, which have potential to generate enough electricity from rooftop SPV installation; rooftop SPV installation would be the revolutionary method of rural electrification.
-
Rooftop SPV installation is the most adoptable technology in highly populous countries like India, where the monthly electricity consumption of a household ranges from 50 to 100 kWh. Encouragement for roof top SPV based electricity generation rather than centralized generation through incentives, financial aid for initial installation and tax holidays.
To supply electricity to households in remote areas entails investment on infrastructure apart from transmission and distribution (T&D) loss of electricity. Current assessment reveals that T&D loss in Karnataka is about 19.5% resulting in the loss of 7,210.16 GWh (annual demand is 36,975.2 GWh in 2010-11) of energy. Cost of energy loss ranges from Rs. 1,514.13 crores (@ Rs. 2.10/kWh) to Rs. 5,047.11 crores (@ Rs. 7/kWh) depending upon the tariff (in the respective state).
Decentralized generation of electricity through SPV would help in meeting the respective household’s electricity demand apart from the removal of T&D losses [15]. Generation based incentives (GBI) would herald the decentralized electricity generation, which would help in boosting the regional economy. Considering the current level of T & D losses in centralized system, inefficient and unreliable electricity supply, it is necessary to promote decentralized energy generation. Small capacity systems are efficient, economical and more importantly would meet the local electricity demand [15]. The incentive could be
-
Rs. 4.00 per unit for first five years (comparable to subsidies granted to mini hydel projects, the power purchase at Rs 3.40) and Rs. 3.50 for the next two years for the electricity generated from roof top solar PV.
-
Buyback programmes for the electricity generated at household level and in micro grid - GBI of Rs. 5 to be provided for electricity generation (< 5 kW) feeding to the grid by SPV.
-
Free solar home lighting (with LED lamps) under the Chief Minister’s Solar Powered Green House Scheme (CMSPGHS), Government of Karnataka or JNNSM (Jawaharlal Nehru National Solar Mission, Government of India).
-
All street lights and water Supply installations in local bodies to be energized through solar power (or hybrid mechanism) in a phased manner
-
Install solar rooftops in all new government/local body buildings - implementation of solar rooftops could be in a phased manner in the existing government/local body buildings, etc.
-
Exemption from payment of electricity tax to the extent of 100% on electricity generated from solar power projects used for self-consumption/sale to utility to be allowed for at least10 years.
-
Fixing of standards for quality installation.
-
Commercial lighting in advertisement boards should only be from SPV panels. Complete ban on usage of grid electricity for these purposes.
-
Impetus to energy research through generous funding for the R and D activities to ensure further improvements in the grid, technologies, two way communication energy meters (to connect rooftop generation with existing grid), efficient luminaries’ production, low cost wiring, switchgears, appliances, etc.
-
Energy education (focusing mainly on renewable energy technologies, end-use energy efficiency improvements, energy conservation) at all levels. School curriculum shall include renewable energy (RE) concepts.
-
Awareness about energy independence and the necessity of RE sources in the present gloomy energy scenario to the consumers
-
Education and awareness about applications and importance of renewable energy sources.
-
Capacity building of youth through technical education for installation and servicing of SPV panels.
-
Diploma /ITI courses with hand-on training on renewable energy technologies in all taluks
-
Setting up service centers in block development offices to meet the requirement of service support for RE technologies (Solar, biogas, energy efficient Chulas, etc.).
-
Periodic revision of FIT structure and incentives to encourage the consumers.
-
Mandatory one week capacity building / training programmes to all bureaucrats and energy professionals at the initial stages of the career. This is essential as lack of awareness/knowledge among the bureaucrats is the major hurdle for successful dissemination of renewable energy technologies in India
Citation: Ramachandra T.V. and Ganesh Hegde, Decentralized Renewable Energy options for wetern ghats, MGIRED Journal, volume 1(1): 24-43, ISSN 2393-9605.